Websites and CRO · 14 min read
CRO A/B testing: how to design a trustworthy conversion experiment
A trustworthy CRO experiment starts with a business decision, not a cosmetic variation. The VALID framework connects the hypothesis, random assignment, instrumentation, inference and rollout rule before traffic enters the test.
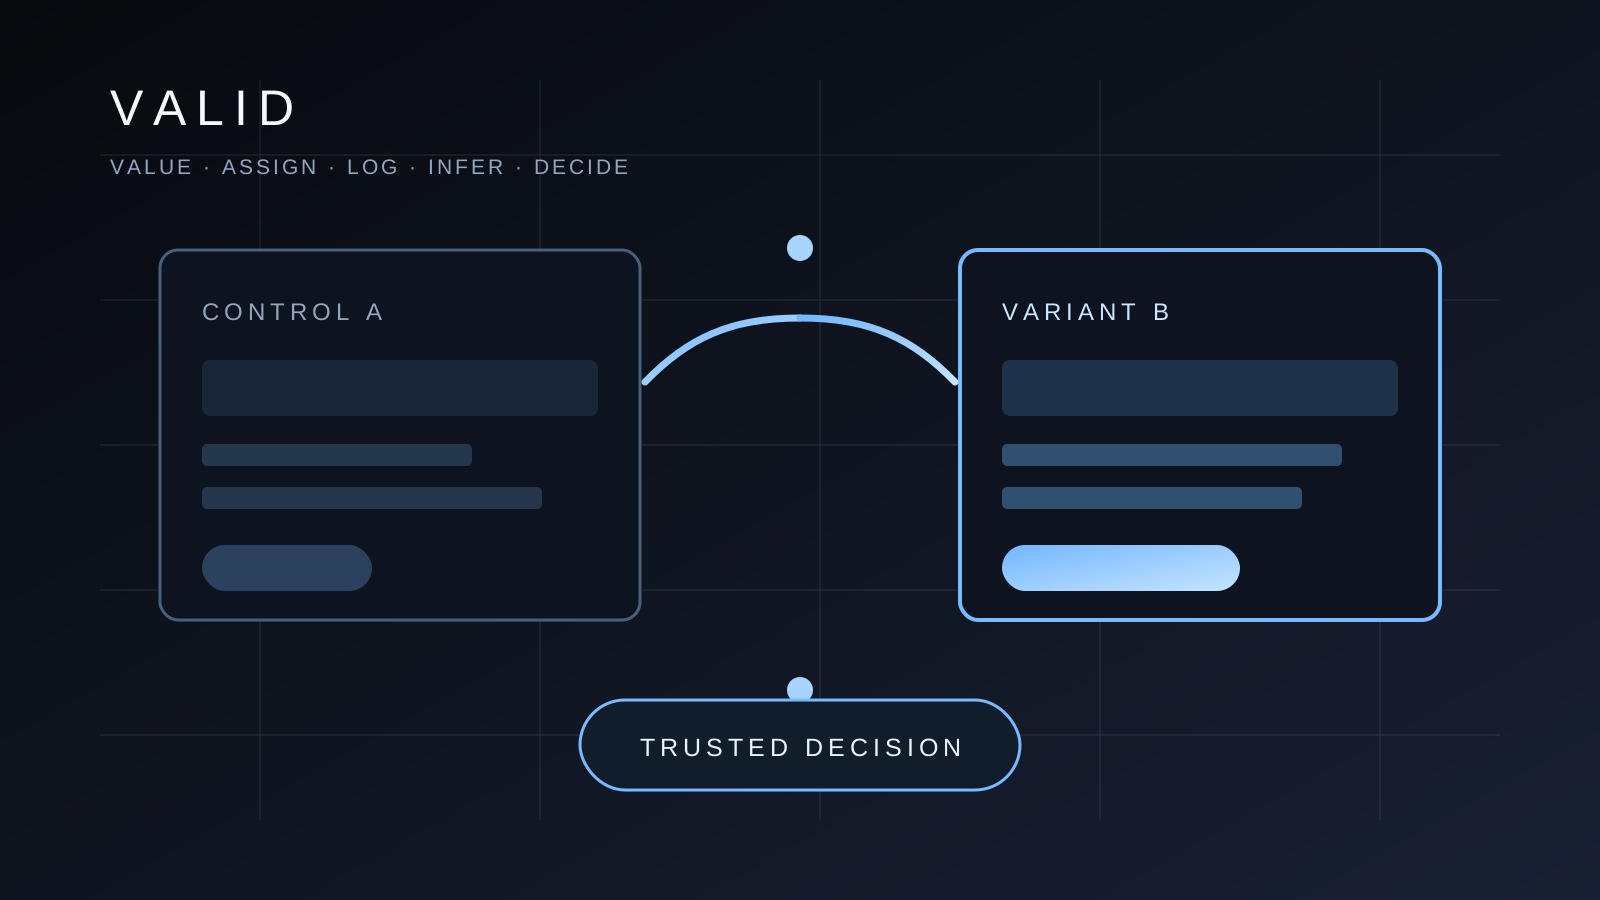
The direct answer: design the decision before the variation
An A/B test is a controlled experiment in which comparable visitors are randomly assigned to the current experience or a deliberate change. When assignment, measurement and analysis are sound, the difference between groups provides much stronger evidence of causality than a simple before-and-after comparison.
The most common failure is not an unattractive B variant. It is a test without a predefined decision, one primary metric, a minimum worthwhile effect and a stopping rule. Such a test can produce an exciting percentage while leaving the team unable to say whether the change is large enough, reliable enough and commercially useful enough to ship.
NUMEDIA uses the VALID framework. V is Value hypothesis, A is Assignment, L is Logging, I is Inference and D is Decision. Together, these controls turn CRO from a sequence of interface tweaks into a repeatable commercial learning system.
Use an A/B test for the questions it can answer
Experimentation is appropriate when traffic can be split between variants, the same outcome can be measured for both groups and the treatment can be isolated with reasonable clarity. Strong candidates include checkout sequence, price presentation, lead form structure, delivery messaging, product-page hierarchy and offer framing.
It is not always the first move. A low-traffic site may need an impractically long test. A complete redesign changes so many elements that the result is difficult to diagnose. An obvious usability defect does not require an experiment before repair. A broken button, failed validation or misleading delivery message should be fixed directly.
User interviews, session review, form analytics and support evidence should uncover friction first. The experiment then tests whether the proposed remedy changes real behaviour in live traffic.
| Question | Best-fit method | Output |
|---|---|---|
| Why are visitors leaving? | Interviews, surveys and session review | Problem hypotheses |
| Does this solution cause more conversions? | Randomized A/B test | Causal effect estimate |
| What changed after the redesign? | Cohort and time-series analysis | Descriptive change, not clean causal proof |
| Does the journey work at all? | Technical and usability audit | Defects to fix immediately |
The VALID framework for trustworthy conversion experiments
V is Value. Connect an observed friction point, the proposed treatment, expected behaviour and commercial outcome. Replace 'a larger button will win' with a falsifiable statement such as: 'Mobile shoppers miss the delivery cost, so showing it before the cart should increase checkout starts without reducing revenue per visitor.'
A is Assignment. A visitor should remain in one variant, and the groups should be comparable. Session-level allocation can expose a returning shopper to both experiences. Use a stable user or device identifier where appropriate, define eligibility before launch and keep treatment assignment independent of future behaviour.
L is Logging. Record exposure before the outcome, prevent duplicate events and verify that both variants use the same metric definition. Microsoft warns that missing users are often not random. A Sample Ratio Mismatch, or SRM, check therefore comes before reading treatment effects.
I is Inference. Plan sample size from the baseline rate, minimum detectable effect, acceptable error rate and desired power. Report the absolute effect and an uncertainty interval, not only a relative uplift. NIST explains the direct relationship between hypothesis tests and confidence intervals.
D is Decision. Define in advance what triggers rollout, rejection, repetition or further research. The decision must consider the primary outcome, guardrail metrics, uncertainty, implementation cost and risk elsewhere in the journey.
Choose one primary metric and meaningful guardrails
The primary metric should be the closest reliable behavioural outcome that still represents business value. For a lead-form change, it might be the rate of successfully submitted qualified enquiries. For a product-page change, add-to-cart rate might be primary, with purchase rate and revenue per visitor as important secondary outcomes.
A large scorecard increases the chance that at least one metric looks positive by accident. Optimizely separates primary, secondary and monitoring metrics and applies controls for multiple comparisons. Before launch, choose one primary metric, a short set of diagnostic secondary metrics and explicit guardrails.
Guardrails prevent a local win from damaging the system. A higher click-through rate on an aggressive CTA is not success if it produces more cancellations, lower lead quality, slower pages or additional support demand. Ecommerce experiments should monitor checkout errors, revenue per visitor, returns, margin, speed and critical device segments.
- Name one primary metric before traffic enters the test.
- Express the minimum worthwhile effect in absolute and commercial terms.
- Use secondary metrics to explain the journey, not to manufacture winners.
- Cover revenue, quality, technical reliability and user risk with guardrails.
- Document event definitions, denominators and attribution windows.
- Predefine important device, channel or market segments.
Plan sample size and duration before launch
Sample size is not an arbitrary number displayed by a tool. It depends on the baseline conversion rate, the smallest effect worth detecting, the tolerated false-positive rate and statistical power. Smaller effects require more visitors. Rare downstream conversions also need more traffic than common upstream interactions.
The test should normally cover complete business cycles so that groups are not compared across different days or an unusual fragment of the week. It should not run indefinitely. Google recommends keeping website experiments active only as long as necessary for a reliable conclusion, then removing the testing infrastructure and implementing the chosen experience.
Do not stop the first time a dashboard turns green unless the statistical method explicitly supports sequential monitoring and the stopping rule is part of that method. A classical fixed-horizon calculation assumes a predetermined sample. Repeated peeking and stopping on the first favourable result can increase the chance of a wrong decision.
Check SRM and data quality before treatment effects
With a planned 50/50 split, visual balance is not enough. An SRM test considers sample size and evaluates whether the observed allocation is plausible under the design. Microsoft's experimentation platform does not interpret treatment results until the allocation passes this check.
SRM can be caused by faulty bucketing, unstable IDs, uneven script loading, redirects, bot filtering, telemetry loss or biased analysis filters. If SRM is present, do not interpret uplift until the root cause is understood. Removing inconvenient users simply to restore the ratio is not a valid repair.
Also run an A/A or smoke test where practical. Check duplicate events, financial reconciliation, time zones, consent modes and browser parity. An experiment with perfect statistical calculations applied to broken events is still a broken experiment.
Read the result in commercial terms
Review data quality first, then the primary metric, the effect interval and guardrails. Convert relative uplift into an absolute change. Moving conversion from 2.0% to 2.2% is a 10% relative uplift but only 0.2 percentage points in absolute terms. Its value depends on traffic, margin and implementation cost.
A non-significant result does not prove that the variants are equal. It means the current design did not produce a sufficiently precise answer. If the interval still includes both a worthwhile gain and meaningful harm, the decision remains uncertain. The team may need more sample, a stronger treatment or a more sensitive metric.
A successful test does not end at deploy. Record the hypothesis, sample, duration, variants, metrics, SRM status, results and decision. After rollout, confirm that the effect persists at full traffic. This turns each experiment into cumulative knowledge rather than an isolated dashboard screenshot.
| Result | Interpretation | Next action |
|---|---|---|
| Positive primary effect, stable guardrails | The change is probably useful | Progressive rollout and monitoring |
| Positive local KPI, worse revenue or quality | Local optimization harms the system | Revise the hypothesis before shipping |
| Wide interval and inconclusive result | The test produced too little information | More sample or a stronger treatment |
| SRM or failed instrumentation | The result is not trustworthy | Repair the cause and rerun |
Protect organic search while testing public pages
A conversion test on an indexable page must not deliberately show Googlebot different content from human visitors. Google classifies that as cloaking. When variants use separate URLs, test URLs should point to the original with a canonical. Temporary redirects should use 302 rather than permanent 301 redirects.
Remove alternative URLs, scripts and temporary redirects after the experiment. If the treatment changes the title, core copy, internal links or indexability, add SEO guardrails before launch. A conversion improvement is not a win if the page loses qualified organic demand.
Small interface treatments usually carry less search risk. Large content changes require CRO and SEO owners to agree on what crawlers see, which URL remains canonical and how the winning experience becomes the permanent page after the test.
Sources and methodology
- A/B Testing Best Practices for Search (Google Search Central, accessed 13 October 2026)
- Diagnosing Sample Ratio Mismatch in A/B Testing (Microsoft Research, accessed 13 October 2026)
- Statistical Challenges in Online Controlled Experiments: A Review of A/B Testing Methodology (arXiv, accessed 13 October 2026)
- What is the relationship between a test and a confidence interval? (NIST/SEMATECH, accessed 13 October 2026)
- Primary metrics, secondary metrics, and monitoring goals (Optimizely, accessed 13 October 2026)
- Metric Interpretation Pitfalls in Online Controlled Experiments (Microsoft Research, accessed 13 October 2026)
Frequently asked questions
What is a website A/B test?
It is a controlled experiment that randomly assigns comparable users to two experiences and measures the difference in a predefined outcome.
How many visitors does an A/B test need?
The required sample depends on baseline conversion, the minimum worthwhile effect, acceptable error and statistical power. There is no universal visitor count, so calculate it before launch.
How long should an A/B test run?
Long enough to reach the planned sample and cover normal business cycles. Do not stop at the first favourable reading or continue unnecessarily after a reliable decision.
What is Sample Ratio Mismatch?
SRM occurs when the observed allocation across variants is statistically inconsistent with the planned split. It can indicate an assignment, telemetry or analysis defect, so treatment effects should not be trusted before diagnosis.
Is a statistically significant result always valuable?
No. A small effect can be statistically reliable but commercially irrelevant. The decision must consider absolute impact, margin, implementation cost and guardrail metrics.
Can A/B testing hurt SEO?
A correctly implemented test should not. Google recommends avoiding cloaking, using canonicals for alternate URLs, using temporary 302 redirects and removing test elements after completion.