Performance measurement · 13 min read
Marketing mix modeling for better budget allocation
Marketing mix modeling helps leadership decide where the next unit of media budget should go. The useful output is not a single attribution score, but a set of response curves, uncertainty ranges and constrained investment scenarios.
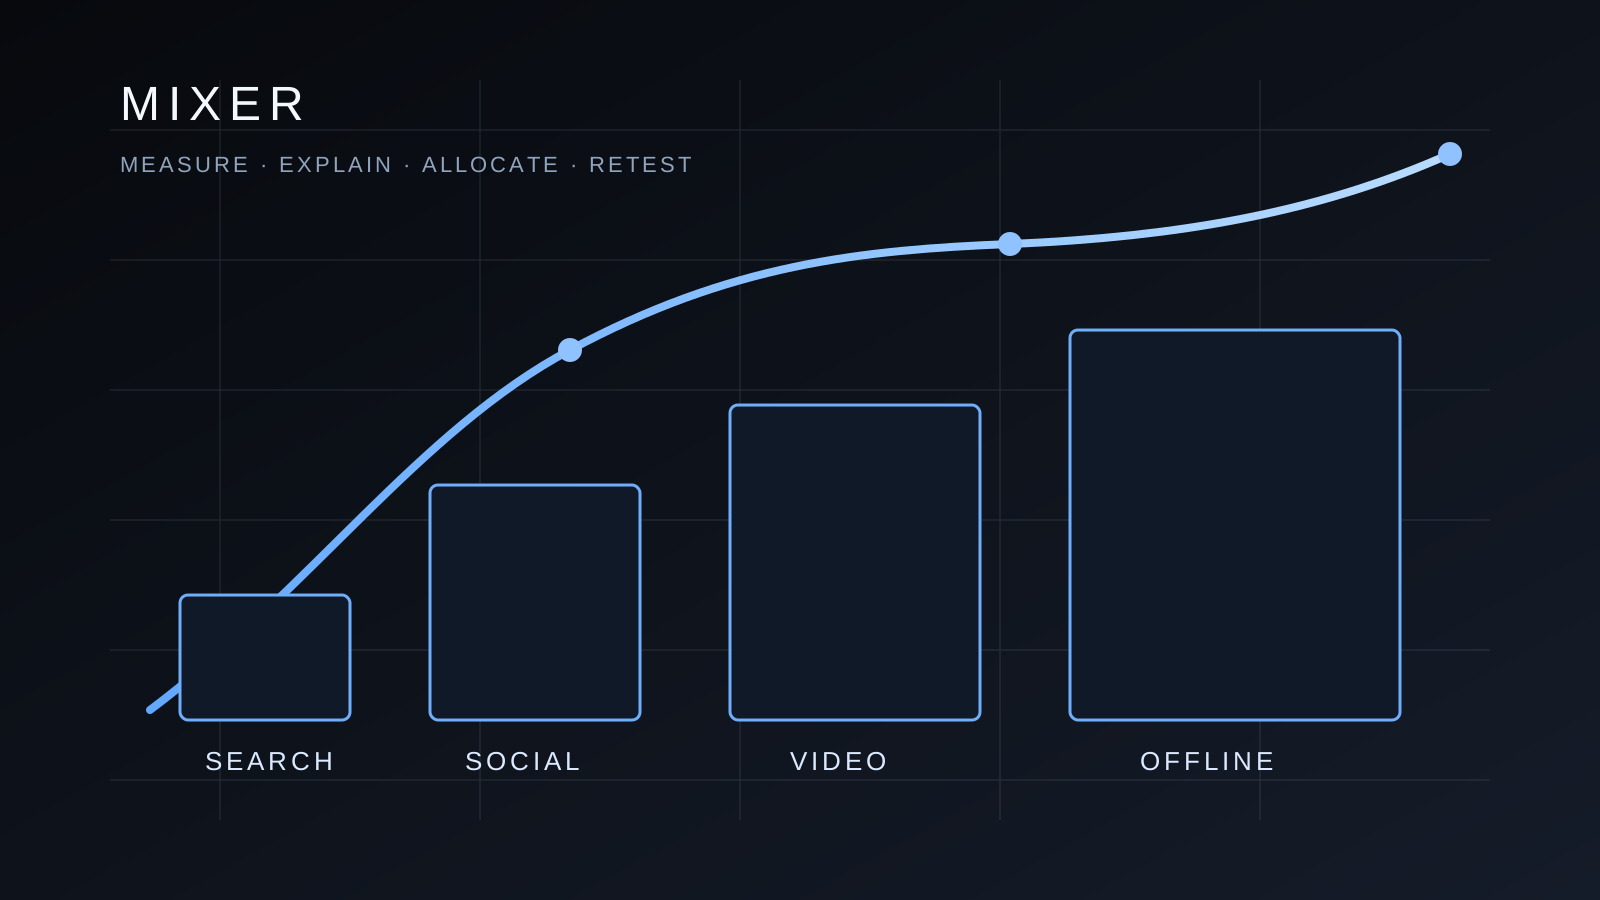
The direct answer: MMM supports cross-channel budget decisions
Marketing mix modeling, commonly shortened to MMM, uses aggregated time-series data to estimate how paid media, organic activity, pricing, promotions, seasonality and other business factors relate to sales or another commercial KPI. Its strongest use is strategic allocation across channels rather than user-level attribution.
MMM becomes valuable when investment spans several channels, revenue happens online and offline, or user tracking cannot represent the full buying journey. Google Meridian treats MMM as a causal inference method built from observational data. That distinction matters because results depend on the quality of the data, the control set and assumptions about how the business works.
A credible model does not produce one deceptively precise answer for every channel. It provides plausible ranges, exposes uncertainty and leads to a decision that can be validated. The operating goal is better capital allocation, not a model that merely confirms the current media plan.
Use MMM for the questions it can answer
MMM is suited to questions such as how much incremental outcome each channel generated, where diminishing marginal returns begin, how the same total budget could be redistributed and what a larger or smaller investment might deliver. Meta's Robyn guide also frames optimal channel spend and the destination of the next marketing dollar as core MMM questions.
It is not the right tool for selecting a creative inside one campaign, changing bids every day or assigning an individual order to a touchpoint. Platform experiments, event-level measurement and operational dashboards are better for those jobs. MMM works at a higher decision level: channel, market, time period and business outcome.
Nor is an observational model automatic proof of causality. Google notes that multiple models can fit historical data well while producing different ROI and optimization estimates. Teams must document causal reasoning, account for important confounders and calibrate with experiments where possible.
| Business question | Best-fit method | Typical cadence |
|---|---|---|
| How should budget move across channels? | MMM and scenario planning | Quarterly or after a major change |
| Did a channel create incremental sales? | Incrementality or geo experiment | By test plan |
| Which creative or keyword performs? | Platform experiments and events | Daily to weekly |
| Is total growth profitable? | Contribution margin, POAS and finance | Weekly to monthly |
The MIXER framework: from question to allocation
M is Mandate. Define the decision, KPI, horizon and constraints before modeling. A useful brief asks how to distribute a fixed quarterly budget across search, social, video and offline media while preserving a minimum viable investment in each channel.
I is Inputs. Build consistent time series for the KPI, media execution, spend and controls. Google recommends weekly granularity and, where feasible, geographic detail. The outcome must be additive, such as revenue, units or conversions, rather than a rate such as CTR.
X is eXplain causality. Draw a simple causal graph. Include variables that affect both media decisions and the outcome, such as seasonality, pricing, promotions, distribution and major market events. Avoid controlling for mediators when doing so would block part of the effect you intend to estimate.
E is Estimate and evaluate. Estimate carryover, saturation, baseline demand and uncertainty. Review convergence, posterior predictions, response-curve plausibility and stability. Predictive accuracy alone is not sufficient because the business objective is causal allocation.
R is Reallocate and retest. Optimize under practical lower and upper bounds, contractual commitments and execution constraints. Introduce changes gradually, then use the next cycle as new evidence or an experiment for model calibration.
Data readiness determines whether MMM is useful
A minimum dataset contains date, market or geography, the KPI, spend by channel, an execution measure by channel and relevant controls. Meridian requires media execution and spend to share the same dimensions. Revenue, conversions or units must align to the same time and geographic keys.
Weekly data often balances variation and noise. Meridian's general guidance is at least two years of weekly data for geo-level models and three years for national models, but this is not a universal guarantee. Required history depends on the number of channels, geographic structure, spend variation and model complexity.
Campaigns normally need to be grouped into decision-ready channels. Excessive detail creates too many parameters and weak signals. Over-aggregation hides channels with different economics. Keep a channel separate when it has sufficient variation, meaningful spend and a budget decision that can genuinely be made independently.
- Align KPI, spend and execution to one calendar, currency and geography.
- Resolve missing values, duplicate periods and historical naming changes.
- Document promotions, prices, holidays, distribution and major external shocks.
- Combine or exclude channels with negligible spend and explain the choice.
- Keep definitions stable across the full modeling period.
- Have finance validate the KPI and marketing validate the media timeline.
Adstock, saturation and marginal ROI
Adstock represents delayed and decaying media effects. Activity in one week may influence outcomes in later weeks. Saturation represents diminishing marginal response: the first increment of spend can produce more additional outcome than the next increment when a channel is already heavily funded.
These curves drive allocation. Average ROI describes the estimated historical relationship between outcome and spend. Marginal ROI estimates the effect of the next unit of investment at the current point on the response curve. A channel with excellent historical ROI may not be the best destination for additional budget if it is already close to saturation.
An optimizer should compare marginal effects while preserving uncertainty and operating constraints. Meridian supports a fixed-budget scenario that seeks the allocation with the highest expected ROI or incremental KPI, as well as flexible scenarios constrained by target ROI or minimum marginal ROI. The output is a planning scenario, not an instruction to ignore execution realities.
Calibration connects the model to experimental evidence
MMM relies on observational data, so assumptions matter. Incrementality tests can provide stronger channel-specific evidence. Meridian supports experiment results and business knowledge in channel priors, while Meta Robyn treats experimental calibration as an important input to model selection.
Calibration does not mean copying one test result directly into the model. An experiment has its own period, spend level, population and uncertainty. Meridian explains that there is no single formula for translating a test into a prior and that differences between the experimental estimand and the model estimand must be considered.
A practical measurement programme combines the breadth of MMM with the depth of experiments. MMM identifies decisions that are uncertain or financially material. A test investigates a selected channel. The result then informs the next model cycle.
Read results without false precision
Show every channel estimate with uncertainty, not just a mean. A wide interval means the available evidence cannot clearly separate plausible effects. That does not automatically make the channel ineffective, but it makes a large reallocation risky without further evidence.
Inspect whether baseline demand, seasonality and response curves are commercially plausible. If a model assigns an enormous effect to a channel with little variation or produces an implausibly steep curve, review the data, priors and controls. Google explicitly warns that strong predictive fit alone does not validate a causal estimate.
Present leadership with conservative, recommended and exploratory scenarios. For each, state the allocation, expected KPI range, main assumptions and validation plan. This turns MMM into decision governance rather than a contest for the most attractive ROI slide.
A 90-day implementation plan
In the first two weeks, define the business question, KPI, channels, markets and constraints. Inventory data sources and assign owners. If the company lacks stable history, improve collection first rather than forcing a weak model.
By the end of month one, assemble the weekly modeling table, run exploratory analysis and reconcile anomalies with marketing and finance. Document the causal graph and acceptance criteria before reviewing outcomes.
During month two, estimate several defensible specifications and examine convergence, fit, response curves and prior sensitivity. Compare outputs with known experiments, business events and financial totals.
In month three, develop constrained reallocation scenarios. Move a limited share of budget first, measure execution and define a test for the most important uncertainty. Finish by setting the refresh cadence and ownership for changes to definitions.
Sources and methodology
- Collect and organize your data (Google Meridian, accessed 9 October 2026)
- About MMM as a causal inference methodology (Google Meridian, accessed 9 October 2026)
- Assess the model fit and the results (Google Meridian, accessed 9 October 2026)
- Budget optimization scenarios (Google Meridian, accessed 9 October 2026)
- Calibrate treatment priors (Google Meridian, accessed 9 October 2026)
- An Analyst's Guide to MMM (Meta Robyn, accessed 9 October 2026)
- Budget Allocation with PyMC-Marketing (PyMC-Marketing, accessed 9 October 2026)
Frequently asked questions
What is marketing mix modeling?
Marketing mix modeling is a statistical approach that uses aggregated time-series data to estimate how media and other business factors affect sales or another KPI, then supports cross-channel budget scenarios.
How much data does an MMM need?
It depends on channels, geography and model complexity. Meridian gives a general starting point of roughly two years of weekly geo data or three years of national data, but teams must evaluate data sufficiency for the actual specification.
Does MMM replace attribution?
No. MMM supports aggregate cross-channel decisions. Event measurement remains useful for in-channel operations, while experiments provide more direct evidence of incremental impact.
What is marginal ROI?
Marginal ROI estimates the return on the next unit of spend at the current investment level. It is often more useful for reallocation than historical average ROI because it reflects channel saturation.
How often should an MMM be refreshed?
The cadence depends on market change and data volume. Quarterly or twice-yearly updates are common planning rhythms, with an extra refresh after material changes to pricing, channels, markets or measurement.
Can a smaller business use MMM?
Yes, when it has sufficient clean history, variation in spend and a meaningful allocation decision. With limited data, focused experiments and stronger financial measurement may be the more reliable first step.