AI implementation in practice · 8 min read
AI management reporting: what implementation would look like in your company
If colleagues copy figures from advertising, analytics and sales before every meeting, reporting consumes time before the first decision is made. An AI agent could collect agreed data, check completeness and prepare a draft summary. Management would receive the current position, exceptions and questions for accountable owners in a format people actually use.
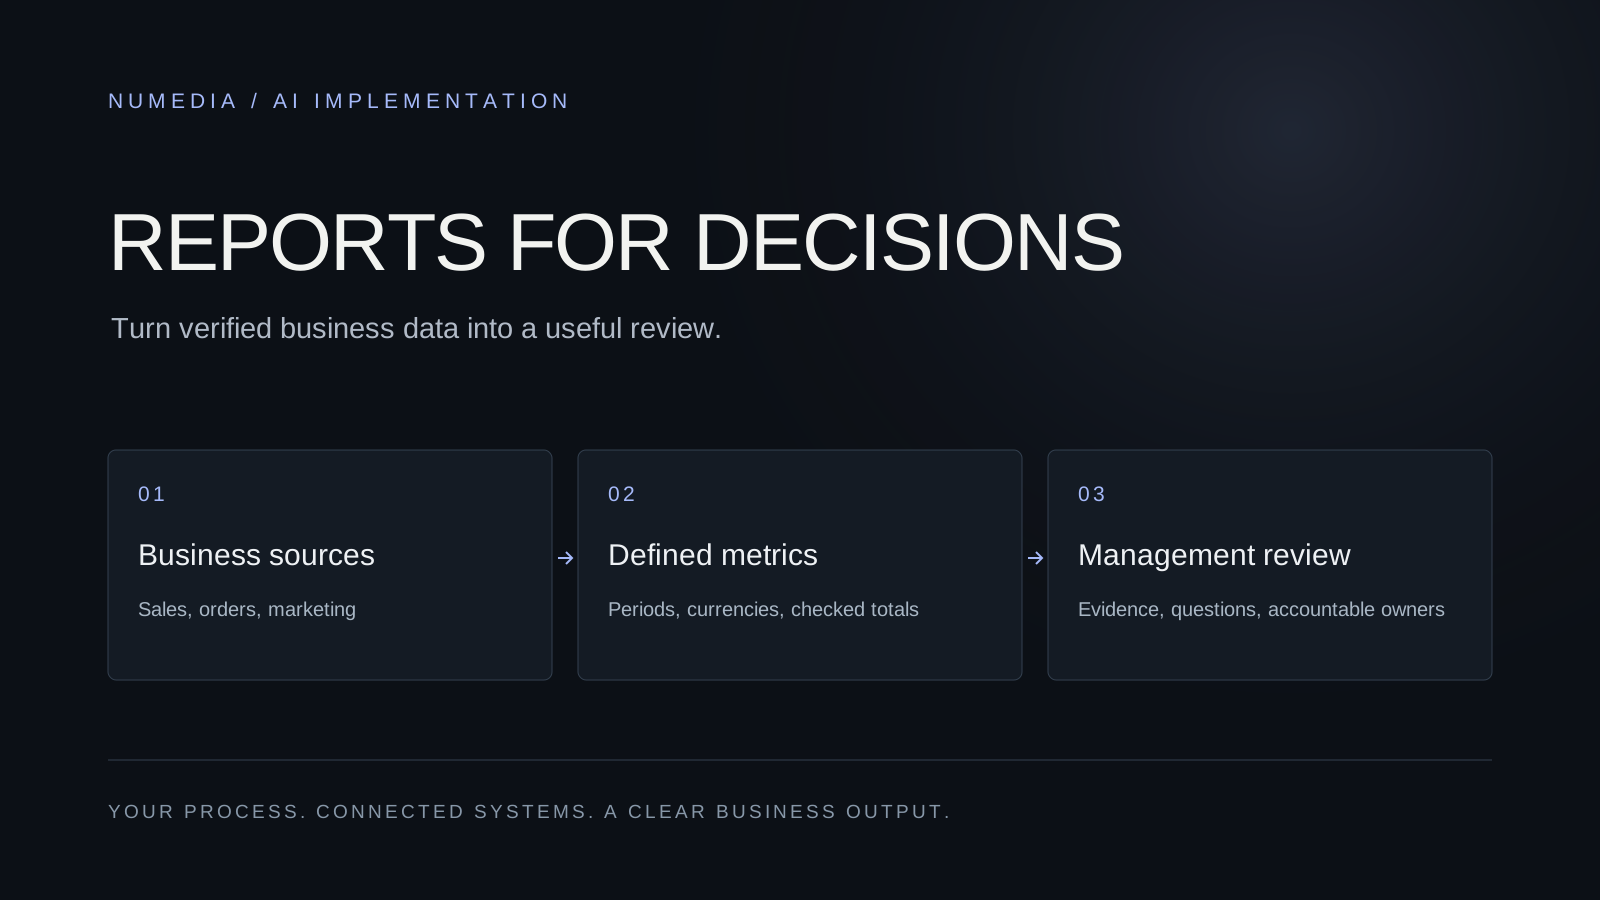
Your Monday meeting could begin with decisions
NUMEDIA would design implementation around one management routine, such as a weekly sales and marketing review. The following scenario is a hypothetical proposal for a company with several digital data sources. It does not present measurements from a specific client. It shows what we would connect, what you would receive and how reduced preparation work could be assessed.
What management would receive
The proposed report would answer three questions first: what changed, which data supports that observation and who should investigate the next step. A table of agreed metrics and comparison periods would follow. Each significant finding would identify its source, period and limitations. Readers could inspect the detail rather than accept an unsupported narrative.
Suppose enquiries increase while closed deals decrease. The agent should not automatically claim that marketing is attracting worse prospects. It would prepare a question for sales, show the available comparison and identify missing information. The report supports a conversation between departments while keeping observed changes separate from explanations of why they occurred.
Begin with the decision you need to make
During discovery, we would ask what management should do after reading the report. Review neglected opportunities, investigate acquisition costs or plan capacity? We then choose a small set of metrics supporting that decision. A larger dashboard is not necessarily more useful. The initial purpose should be specific enough to exclude data without a clear role.
Every metric needs a business definition. A paid order, an analytics purchase event and an advertising platform’s attributed conversion may represent different records. An enquiry is also different from a won deal. NUMEDIA would align definitions with the responsible people before generating summaries. That reduces repeated discussions about the same discrepancies at every meeting.
Connect the sources your decision requires
For a hypothetical sales and marketing review, we would assess access to CRM, orders, analytics and advertising accounts. Google documents reporting through the Analytics Data API and Google Ads API. These illustrate available sources; the actual connections depend on your tools, required information and confirmed implementation scope.
For each source, we would identify the account, timezone, currency and refresh time. A total across different currencies needs an agreed conversion method. Differences in reporting time bases also matter when comparing systems. The underlying report should be verifiable before AI adds its explanation. Otherwise, fluent commentary can conceal a problem in the source comparison.
A weekly report structured around your company
The table describes a proposed project output, rather than promised business results. With management, we would agree which sections are needed, who validates them and where the next action is recorded. A useful report connects evidence with responsibility.
| Section | Contents | Purpose |
|---|---|---|
| Business outcome | Orders or deals from the agreed source | Review actual outcomes |
| Marketing | Spend and platform attribution, separated by source | Investigate performance and discrepancies |
| Sales pipeline | New opportunities and stalled next steps | Assign sales follow-up |
| Data quality | Missing sources, freshness and limitations | Identify checks required first |
| Next actions | Proposals with an owner and due date | Continue the discussion at the next meeting |
AI writes the explanation; calculations follow defined rules
NUMEDIA would separate retrieval, calculations and narrative preparation. Changes and ratios follow agreed formulas. The agent then summarizes verified results and highlights exceptions. This makes it possible to distinguish a source-data problem from a calculation error or an unsupported interpretation, and to fix the relevant part of the workflow.
An empty or failed source response must not silently become zero. When a connection returns no usable information, the report should identify that limitation and withhold conclusions depending on it. For small baselines, show absolute figures alongside percentages. A large percentage change across a few events calls for a different interpretation from the same change across substantial activity.
What NUMEDIA would implement
The proposed engagement covers metric alignment, source mapping, read connections, validation rules and a report template. Together, we would choose the delivery environment, such as an internal dashboard or an agreed team workspace. Reports would follow your meeting rhythm and include a way to inspect supporting details.
Handover would include a metric dictionary, calculation definitions, test cases and a source-failure procedure. The project proposal separates initial connections, any measurement repair and ongoing operation. An unavailable data point becomes an explicit requirement or limitation. The actual scope should be visible rather than hidden inside a general promise of AI analytics.
What your company would contribute
Show us your latest report, source list and the questions that recur in meetings. We also need someone who can approve business definitions and owners for individual data sources. An existing spreadsheet is a useful starting point for understanding the process. It does not mean every column accumulated over time needs to survive into the new report.
Management would choose a useful level of detail and the format for next actions. Sales validates opportunity definitions, marketing confirms how attribution should be read, and the order owner confirms transaction states. NUMEDIA then builds the connected workflow. Early collaboration matters because the system cannot reliably resolve conflicting departmental meanings of the same term by itself.
Evaluate preparation effort and decision usefulness
Illustrative baseline: two people each spend ninety minutes per week collecting and formatting information. Across four weeks, that is twelve hours of work. This is an example of existing effort, not a promise that automation removes all twelve hours. Review, discrepancy investigation and connection maintenance still need to be counted.
The pilot would compare preparation time, corrections and report timeliness. We would also check whether management can trace findings to source figures and assign a meaningful next action. Generating more prose faster does not prove business value. Less preparation alongside better-organized decision-making provides a more credible basis for expansion.
The pilot would include a missing-data scenario
First produce a report for a completed period and compare it with manually verified figures. Then run a limited recurring cycle while source owners check the outputs. We would also test a repeated refresh, an unavailable source and a changed metric definition. These situations belong in ordinary management reporting, rather than being treated as unlikely edge cases.
Handover means you understand report contents, responsibilities and recovery steps. Reporting does not include changing advertising budgets or sales rules unless separately commissioned as a subsequent project. First establish a dependable view. Suggested actions can then become specific tasks with an accountable owner instead of unexplained automatic changes.
Show us the report you currently prepare manually
Write “AI management reporting” in the contact form, list your tools and describe the biggest obstacle in weekly preparation. Include the decision you want to make more easily. An anonymized example is sufficient for an initial discussion. It helps identify the first deliverable, missing data and a feasible implementation boundary.
NUMEDIA would scope the proposal around your management question: what people need, when they need it and which evidence supports it. You receive a practical view of implementation and your team’s contribution. Confirmed scope, pricing and timing follow source assessment and agreement on requirements.
Sources and methodology
- Create a report — Google Analytics Data API (Google, accessed 2026-10-22)
- API dimensions and metrics (Google, accessed 2026-10-22)
- Google Ads API reporting overview (Google, accessed 2026-10-22)
Frequently asked questions
Do we need a new dashboard?
We first assess where management already works and how reports are used. The output could fit an existing environment or justify a new dashboard, depending on the project purpose.
What if GA4 and sales records disagree?
We present them separately with definitions and periods. They are not added together as additional sales. Discrepancies are examined against measurement, attribution and business-event states.
Will the agent change advertising campaigns?
This proposal covers reporting and suggested next actions. Executing changes would require a separate scope with defined rules and authority.
How would you price implementation?
Based on source count, data access, calculations, report format and maintenance. Any measurement repairs are scoped separately to make the proposal transparent.